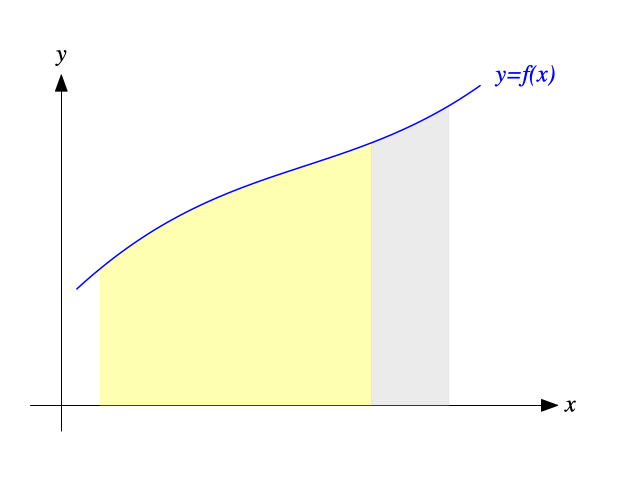
reset
unset border; unset xtics; unset ytics
# 関数
f(x) = 0.6*x + 0.4*cos(x)
# 座標軸
set arrow 10 from -0.2, 0 to 3.2, 0 lw 2 linecolor "black" size graph 0.03,20 filled head
set arrow 11 from 0, -0.1 to 0, 1.3 lw 2 linecolor "black" size graph 0.03,20 filled head
# ラベル
set label 10 left at first 3.25, 0 "x"
set label 11 center at first 0, 1.38 "y"
set label 30 left at first 2.8,1.3 "y=f(x)" textcolor "blue"

# グラフの表示範囲は xrange [-0.2:3.5] だが...
# [x=0.25:2] のプロット範囲で,f(x) と x軸の間を黄色く(透明に)塗り...
# [x=2:2.5] のプロット範囲で,f(x) と x軸の間をグレイに(透明に)塗り...
# [x=0.1:2.7] のプロット範囲で,f(x) を青線で描く。

set style fill transparent solid 0.3 noborder

plot [-0.2:3.5] [-0.2:1.5] sample \
[0.25:2] f(x) with filledc above y=0 fc "yellow" notitle, \
[2:2.5] f(x) with filledc above y=0 fc "gray" notitle, \
[0.1:2.7] f(x) lw 3 linecolor "blue" notitle
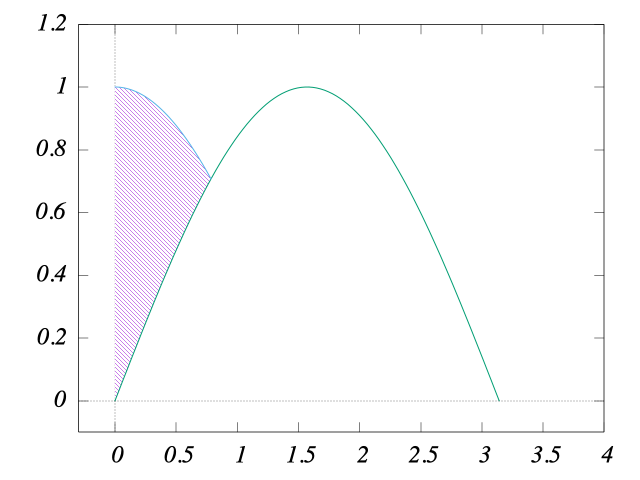
reset
set zeroaxis

# 2つの曲線の間を塗りつぶす例。
# グラフの表示範囲は xrange [-0.3:4] だが...
# [x=0:pi/4] のプロット範囲で,cos(x) と sin(x) の間をパターンで塗り...
# [x=0:pi] のプロット範囲で,sin(x) を描き,
# [x=0:pi/4] のプロット範囲で,cos(x) を描く。

plot [-0.3:4] [-0.1:1.2] sample \
[0:pi/4] '+' using 1:(cos($1)):(sin($1)) with filledc fill pattern 4 notitle, \
[0:pi] sin(x) lw 2 notitle , [0:pi/4] cos(x) lw 2 notitle