ガウス積分の説明で使っているので。
必要なモジュールの import と設定
In [1]:
import matplotlib.pyplot as plt
import numpy as np

# グラフを SVG で Notebook にインライン表示
%config InlineBackend.figure_formats = ['svg']

plt.rcParams['mathtext.fontset'] = 'cm'
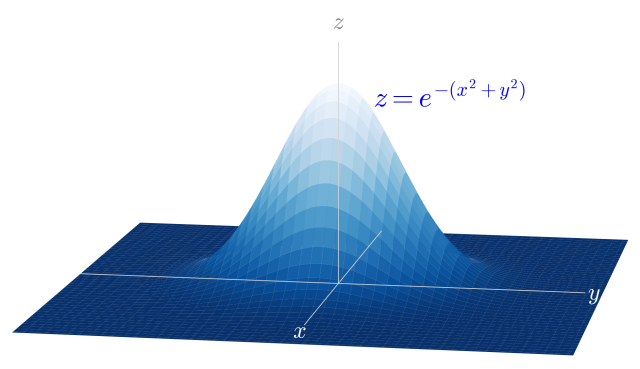
ガウス関数の山
$\displaystyle z = f(x, y) = e^{-(x^2 + y^2)}$ を描く。
In [2]:
def f(x, y):
    return np.exp(-x**2 -y**2)
In [3]:
fig = plt.figure(figsize=[6.4, 6.4])
ax = fig.add_subplot(projection='3d')
fig.subplots_adjust(bottom=0,left=0)

x = np.linspace(-3, 3)
y = np.linspace(-3, 3)
x, y = np.meshgrid(x, y)
ax.plot_surface(x, y, f(x, y), cmap = "Blues_r")

# x 軸
plt.plot([-3, 2.2], [0, 0], [0, 0],
         lw = 0.5, c = "lightgray", zorder=5)
ax.text(2.5, 0, 0, "$x$",
        fontsize="x-large", ha="center", va="center", c='white')
# y 軸
plt.plot([0, 0], [-3, 2.8], [0, 0],
         lw = 0.5, c = "lightgray", zorder=5)
ax.text(0, 2.9, 0, "$y$",
        fontsize="x-large", ha="center", va="center", c='white')
# z 軸
plt.plot([0, 0], [0, 0], [0, 1.2],
         lw = 0.5, c = "lightgray", zorder=5)
ax.text(0, 0, 1.3, "$z$",
        fontsize="x-large", ha="center", va="center", c='gray')

ax.text(0, 0.4, 1, "$z = e^{-(x^2 + y^2)}$",
        fontsize="xx-large", ha="left", va="top", c='blue')

ax.set_xlim(-2.3, 2.3)
ax.set_ylim(-2.3, 2.3)
ax.set_zlim(0, 1.5)
ax.view_init(elev = 10, azim = 10, roll = 0)
ax.axis(False);
plt.savefig("gauss00.png", dpi=360);